
 Doug Hutchinson
How to Invest When the Market is High
With US equity markets trading near all-time highs1, some investors may be concerned about a sell-off in the near future. While this thinking may...
On April 2nd, equity markets experienced significant volatility following President Trump’s Executive Order on tariffs. The Executive Order imposed a 10% universal tariff on US imports and an additional 25% or more tariff on imports from certain countries based on their trade deficit with the United States.
JPMorgan Chief Market Strategist Gabriela Santos expressed a belief that 10% of tariffs are likely permanent, but the additional tariffs may be temporary and subject to negotiation. This article will review:
Equity markets reacted negatively to the tariff announcement because tariffs are widely viewed as harmful to corporate profits and consumer spending. In addition, other countries are likely to respond by increasing tariffs on US exports, which will make US goods less attractive to buy in foreign markets. A softening economy could expedite the global fiscal and monetary response.
JPMorgan Chief Market Strategist Gabriela Santos said, “US additional tax cut discussions are likely to be accelerated, and fiscal stimulus overseas can increase further (especially in Europe and China). Central banks (including the Fed) are likely to focus on responding to the growth hit by lowering rates more than the inflationary impact.”
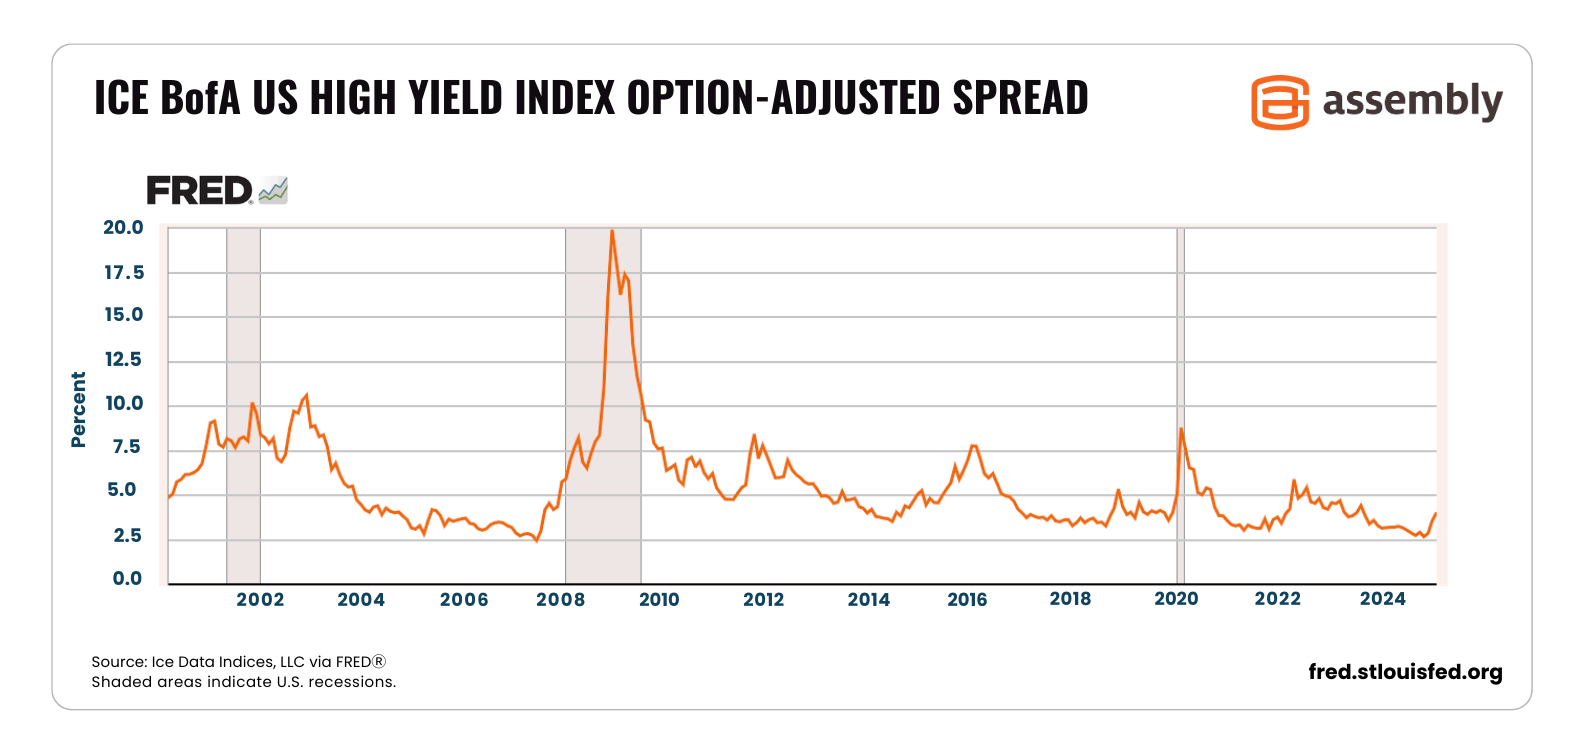
It’s too early to tell if the new tariffs will lead to a recession. Analysts at BlackRock, “Expect [the tariffs] to result in lower growth and higher inflation.” However, they “do not see the new tariffs creating a recession in the US given the resilience of economic fundamentals and consumer balance sheets.” In addition, some recession indicators, such as high-yield credit spreads, are still nowhere near levels seen in previous recessions.
Below is a chart from the Federal Reserve Bank of St. Louis showing high-yield credit spreads. Previous recessions are highlighted in grey.
During market pullbacks, it’s usually helpful to take a deep breath and consider other stressful periods and how the equity market eventually recovered. Rapid declines can certainly be scary when they happen. For example:
But short-term volatility in equities isn’t unusual. The chart below illustrates that the S&P 500 was positive in 34 of the last 45 years despite an average intra-year decline of 14.1%.
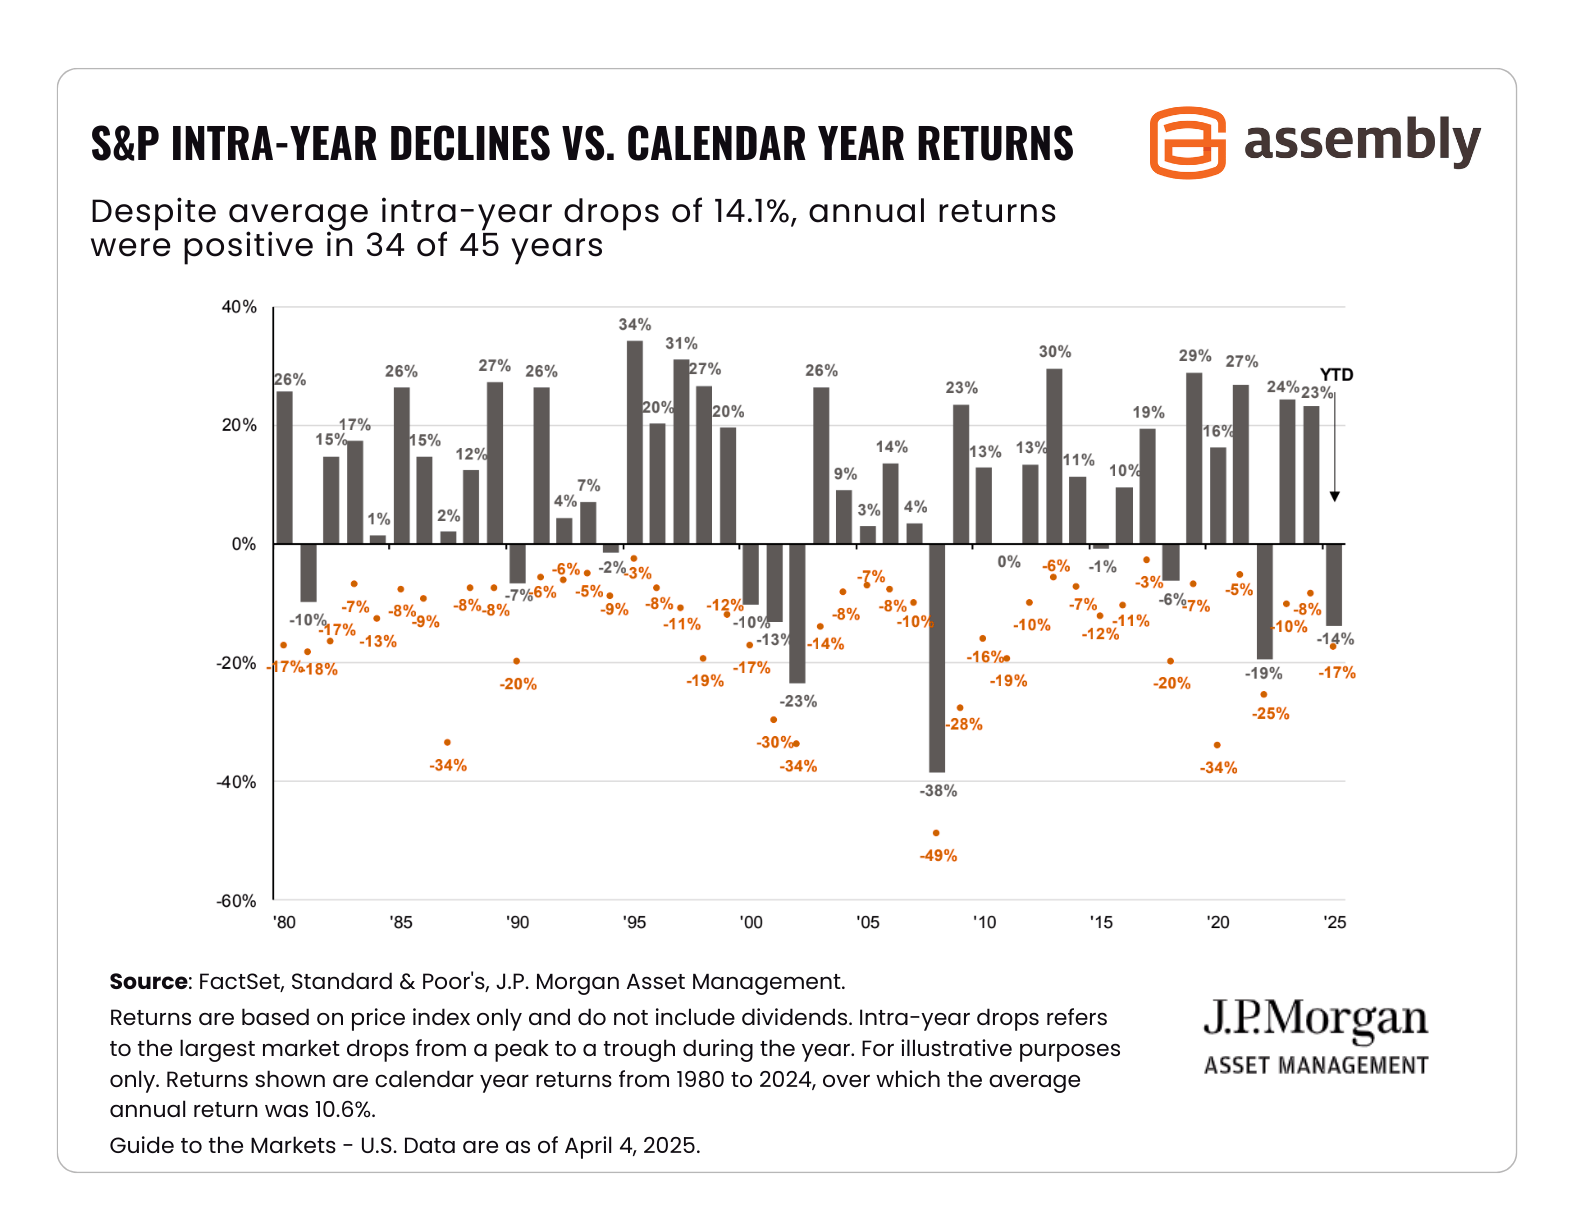
Source: JPMorgan Guide to the Markets April 4, 2025, slide 16
Here’s something each and every bear market in global equities has in common: they were temporary. While they may have been worrisome at the time, global equity markets eventually recovered. Also, bull markets tend to be longer and stronger than bear markets.
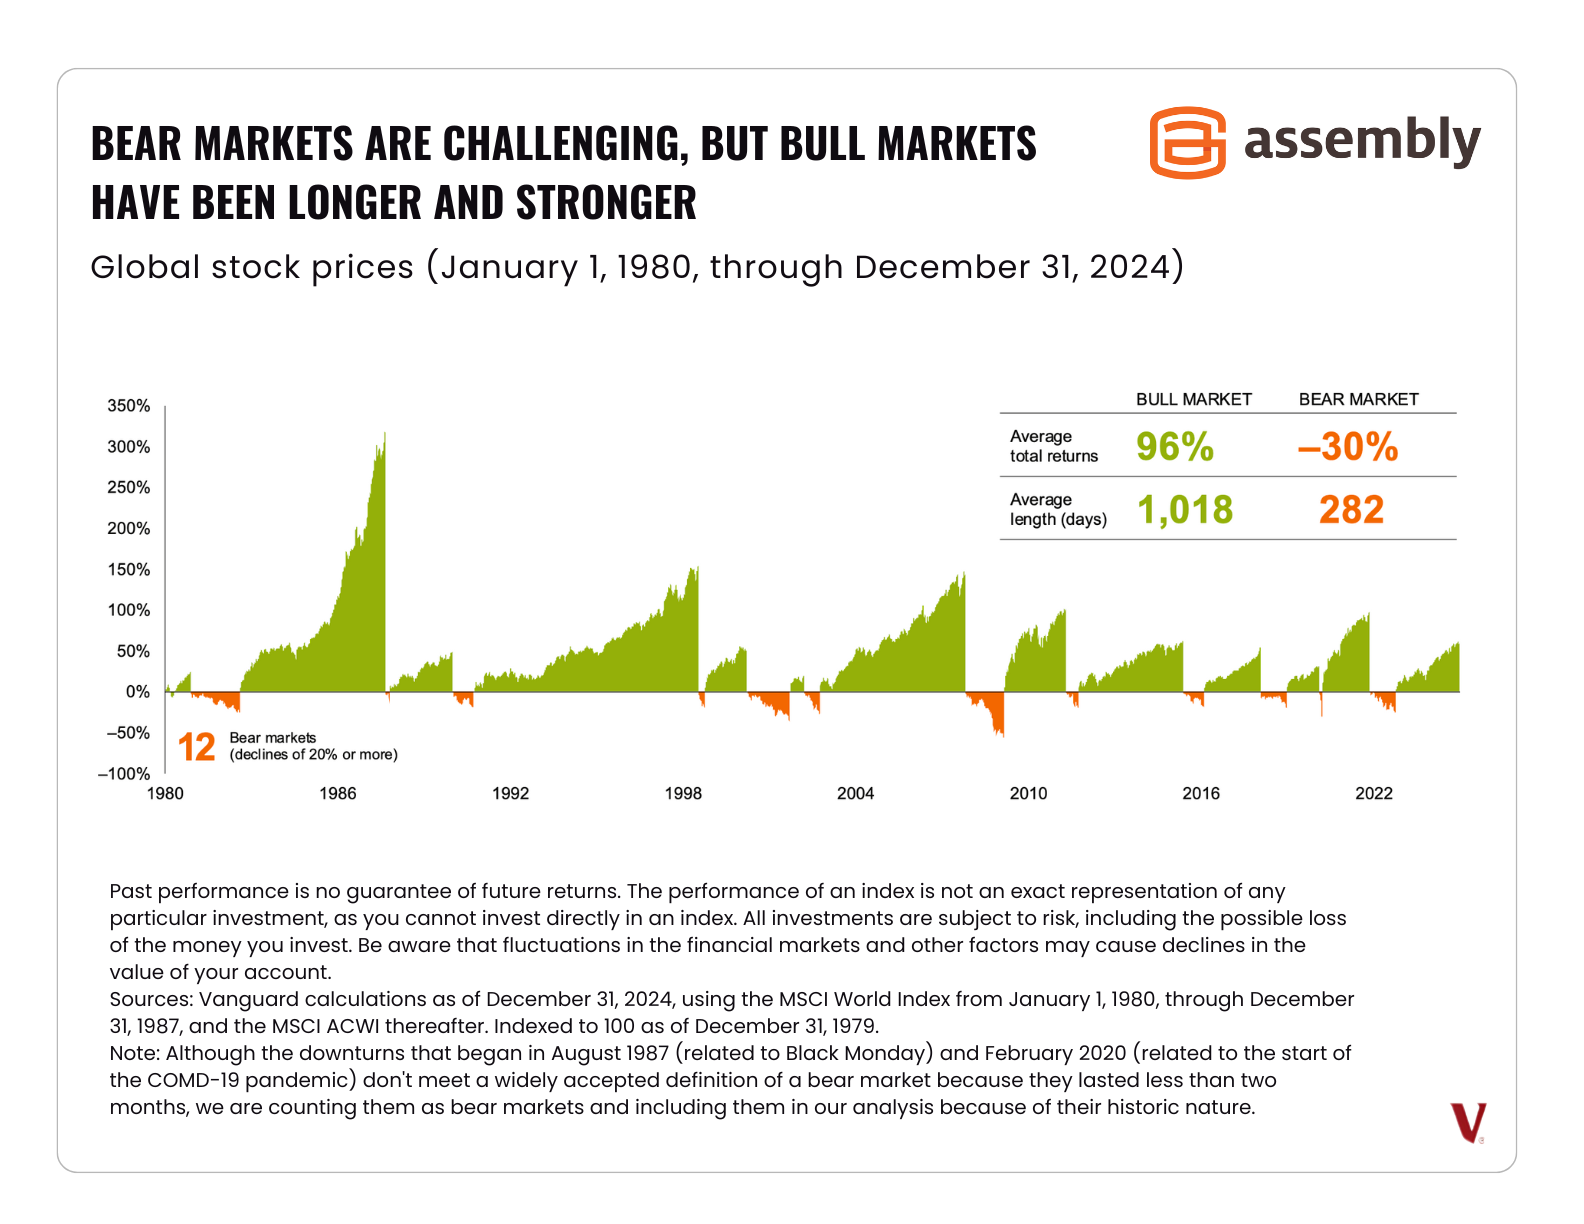
Source: Vanguard Market Volatility Slide Library, page 8
Market returns in a given day, week, month, or even year might be challenging. That said, short-term volatility tends to smooth out over time. This is especially true for a diversified portfolio of both stocks and bonds. Over a 5-year rolling period, a portfolio of 60% equities and 40% bonds has never been negative (from 1950-2024).
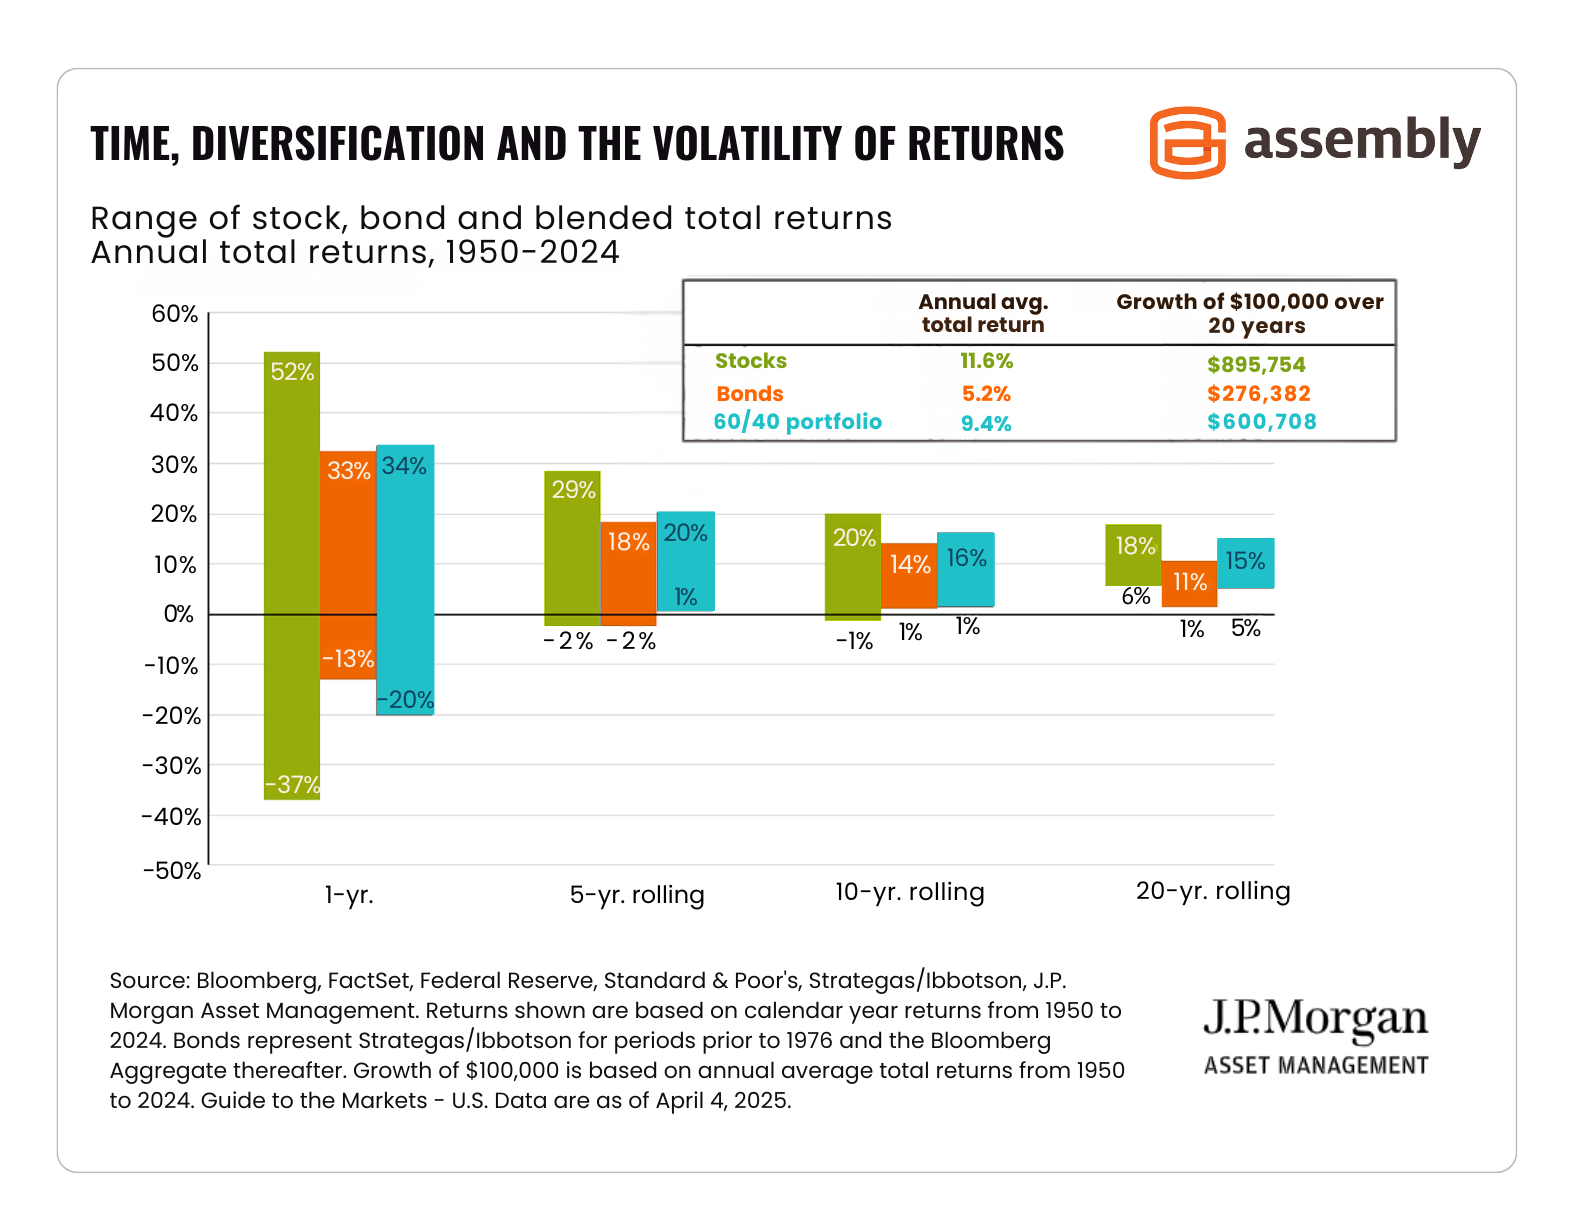
Source: JPMorgan Guide to the Markets April 4, 2025, slide 65
While it may be tempting to sell everything first and ask questions later, liquidating your
portfolio in a panic rarely pays off in the end. Historically, a 60/40 portfolio will outperform a cash position the majority of the time, especially over periods of 12 months or longer.
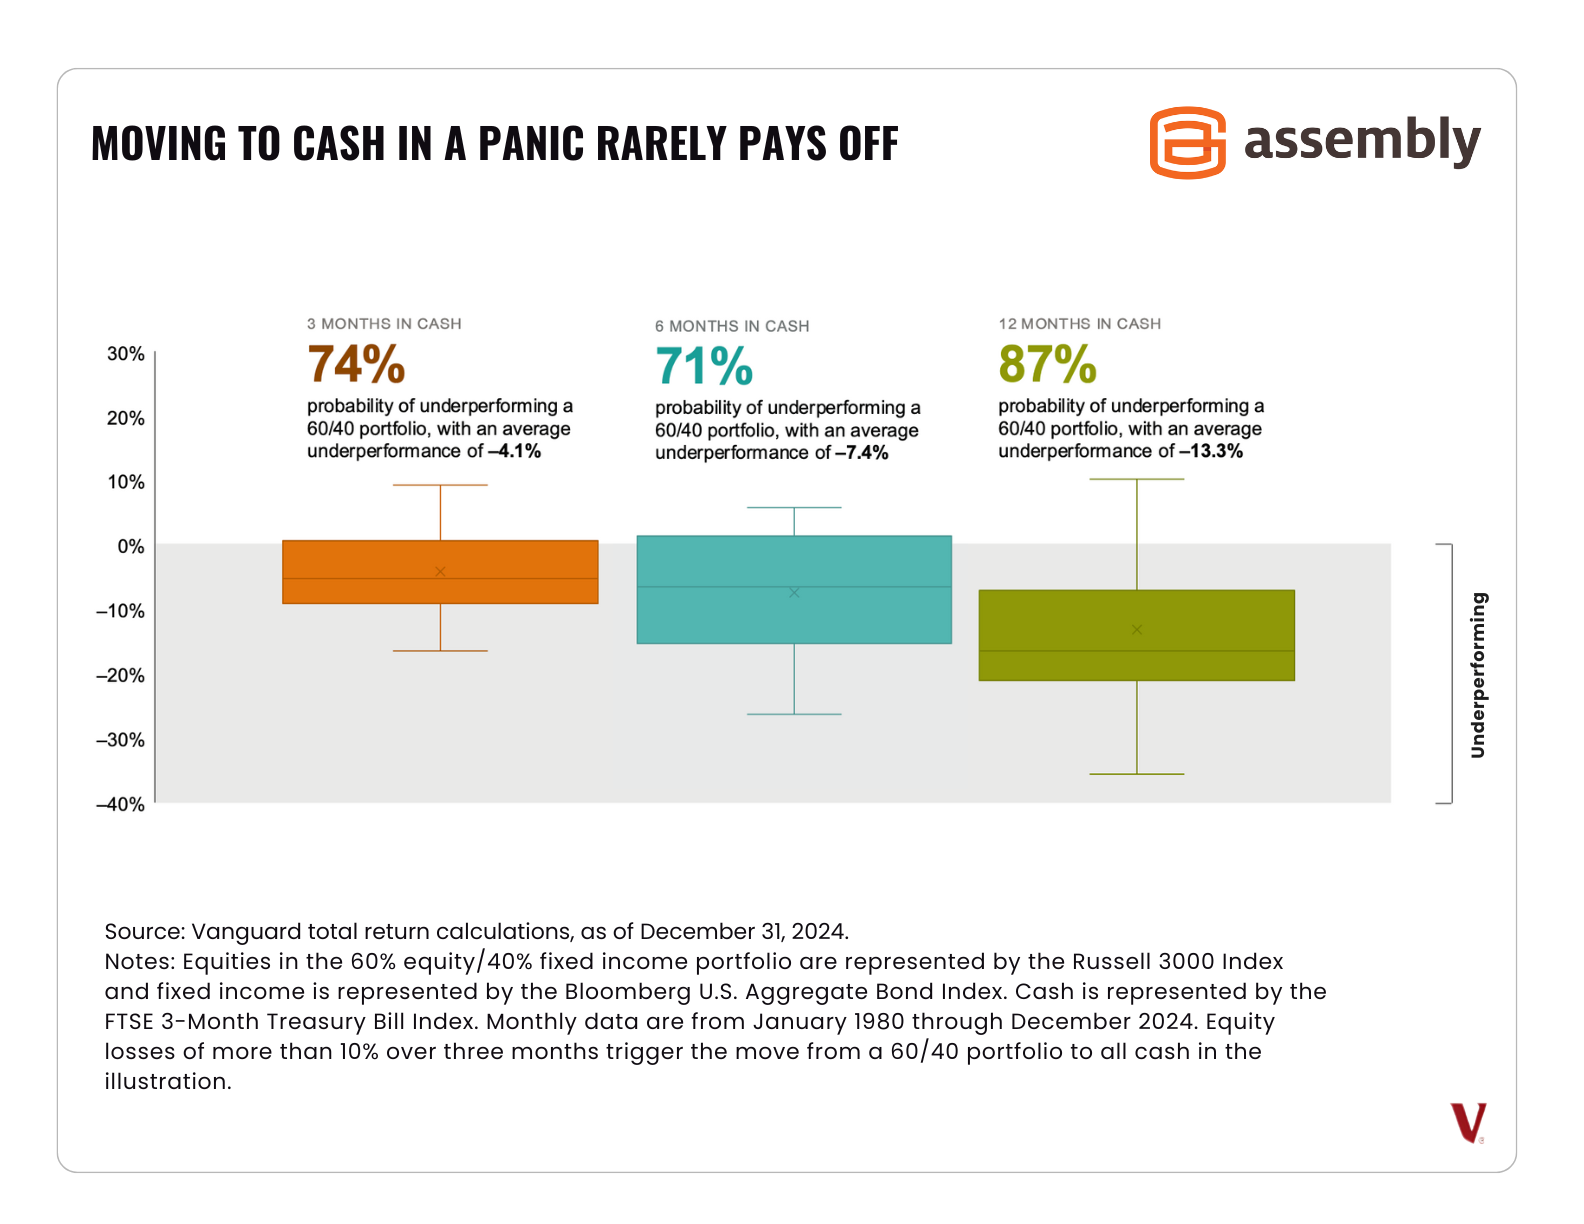
Source: Vanguard Market Volatility Slide Library, page 16
Remember, if history is any guide – the markets will eventually recover. The biggest risk investors face right now might be the temptation of making an unforced error.
Your portfolio was customized for you based on your investment plan and your risk/return profile. While it may be very difficult at the moment to see your portfolio decline in value, making large tactical shifts in your allocation in the face of an extremely volatile market is very risky and may end up backfiring.
Selling everything and re-entering at the market bottom may sound easy in theory. In practice, it’s very, very difficult to precisely time the correct exit and entry points in a volatile market. Instead, it’s more likely you’ll sell at the wrong time and miss out on the recovery rally.
You may have investments that are prime candidates for tax loss harvesting. If you have a large, concentrated position in your portfolio, a pullback could be a great opportunity to book a loss, use the proceeds to better diversify your portfolio and decrease your tax burden. If you’ve been waiting for a pullback and have excess cash on the sidelines, consider dollar cost averaging this cash into stocks.
More than anything, this is an opportunity to work with your Wealth Manager to reassess your portfolio to ensure it is properly balanced between risk and return.
No matter your situation, know that we’re here to help. If you’re unsure what to do, a Wealth Manager can help you navigate these stressful times. Connect with us online or give us a call at (415) 541-7774
Related Reading:

Disclaimer:
Assembly Wealth (“Assembly”) is an SEC registered investment adviser; however, this does not imply any level of skill or training and no inference of such should be made. The opinions expressed herein are as of the date of publication and are provided for informational purposes only. Content will not be updated after publication and should not be considered current after the publication date. We provide historical content for transparency purposes only. All opinions are subject to change without notice and due to changes in the market or economic conditions may not necessarily come to pass. Mention of a security should not be considered a recommendation or solicitation to purchase or sell the security, and any securities mentioned may be held by Assembly for client portfolios.
Information presented represents an opinion as of the date published and should not be considered an investment recommendation. Assembly does not become a fiduciary to any listener, reader or other person or entity by the person’s use of or access to the material. The reader assumes the responsibility of evaluating the merits and risks associated with the use of any information or other content and for any decisions based on such content.

With US equity markets trading near all-time highs1, some investors may be concerned about a sell-off in the near future. While this thinking may...

Diversification is one of the most effective strategies for managing risk and improving long-term investment outcomes. By choosing investments across...

“Sell in May and go away” is an old stock trading adage that is based on a seasonal pattern demonstrated in U.S. equity markets where stocks tend to...