The U.S. presidential election has capitalized the news media, social media, and pop culture for nearly a year now, and we still have several months before the campaign's end and the voters have their say. Here at WrapManager, we don’t take a political stance on elections, but we do track market trends and activity and the election environment can have an effect on the stock market.
It’s interesting to look back at how politics have affected financial markets in the past. Though we can’t predict what might happen this time around, looking back can help us identify previous trends.

Election Years Are Generally Positive
In the 22 presidential election years since 1928, only 4 of those years have seen market declines.* Small caps in particular seem to do well during presidential election years. Equity strategist Sam Stovall found that small caps gained ground 78% of the time during the 4th year of a U.S. presidential election cycle compared to 71% during other years.**
Democrat vs. Republican
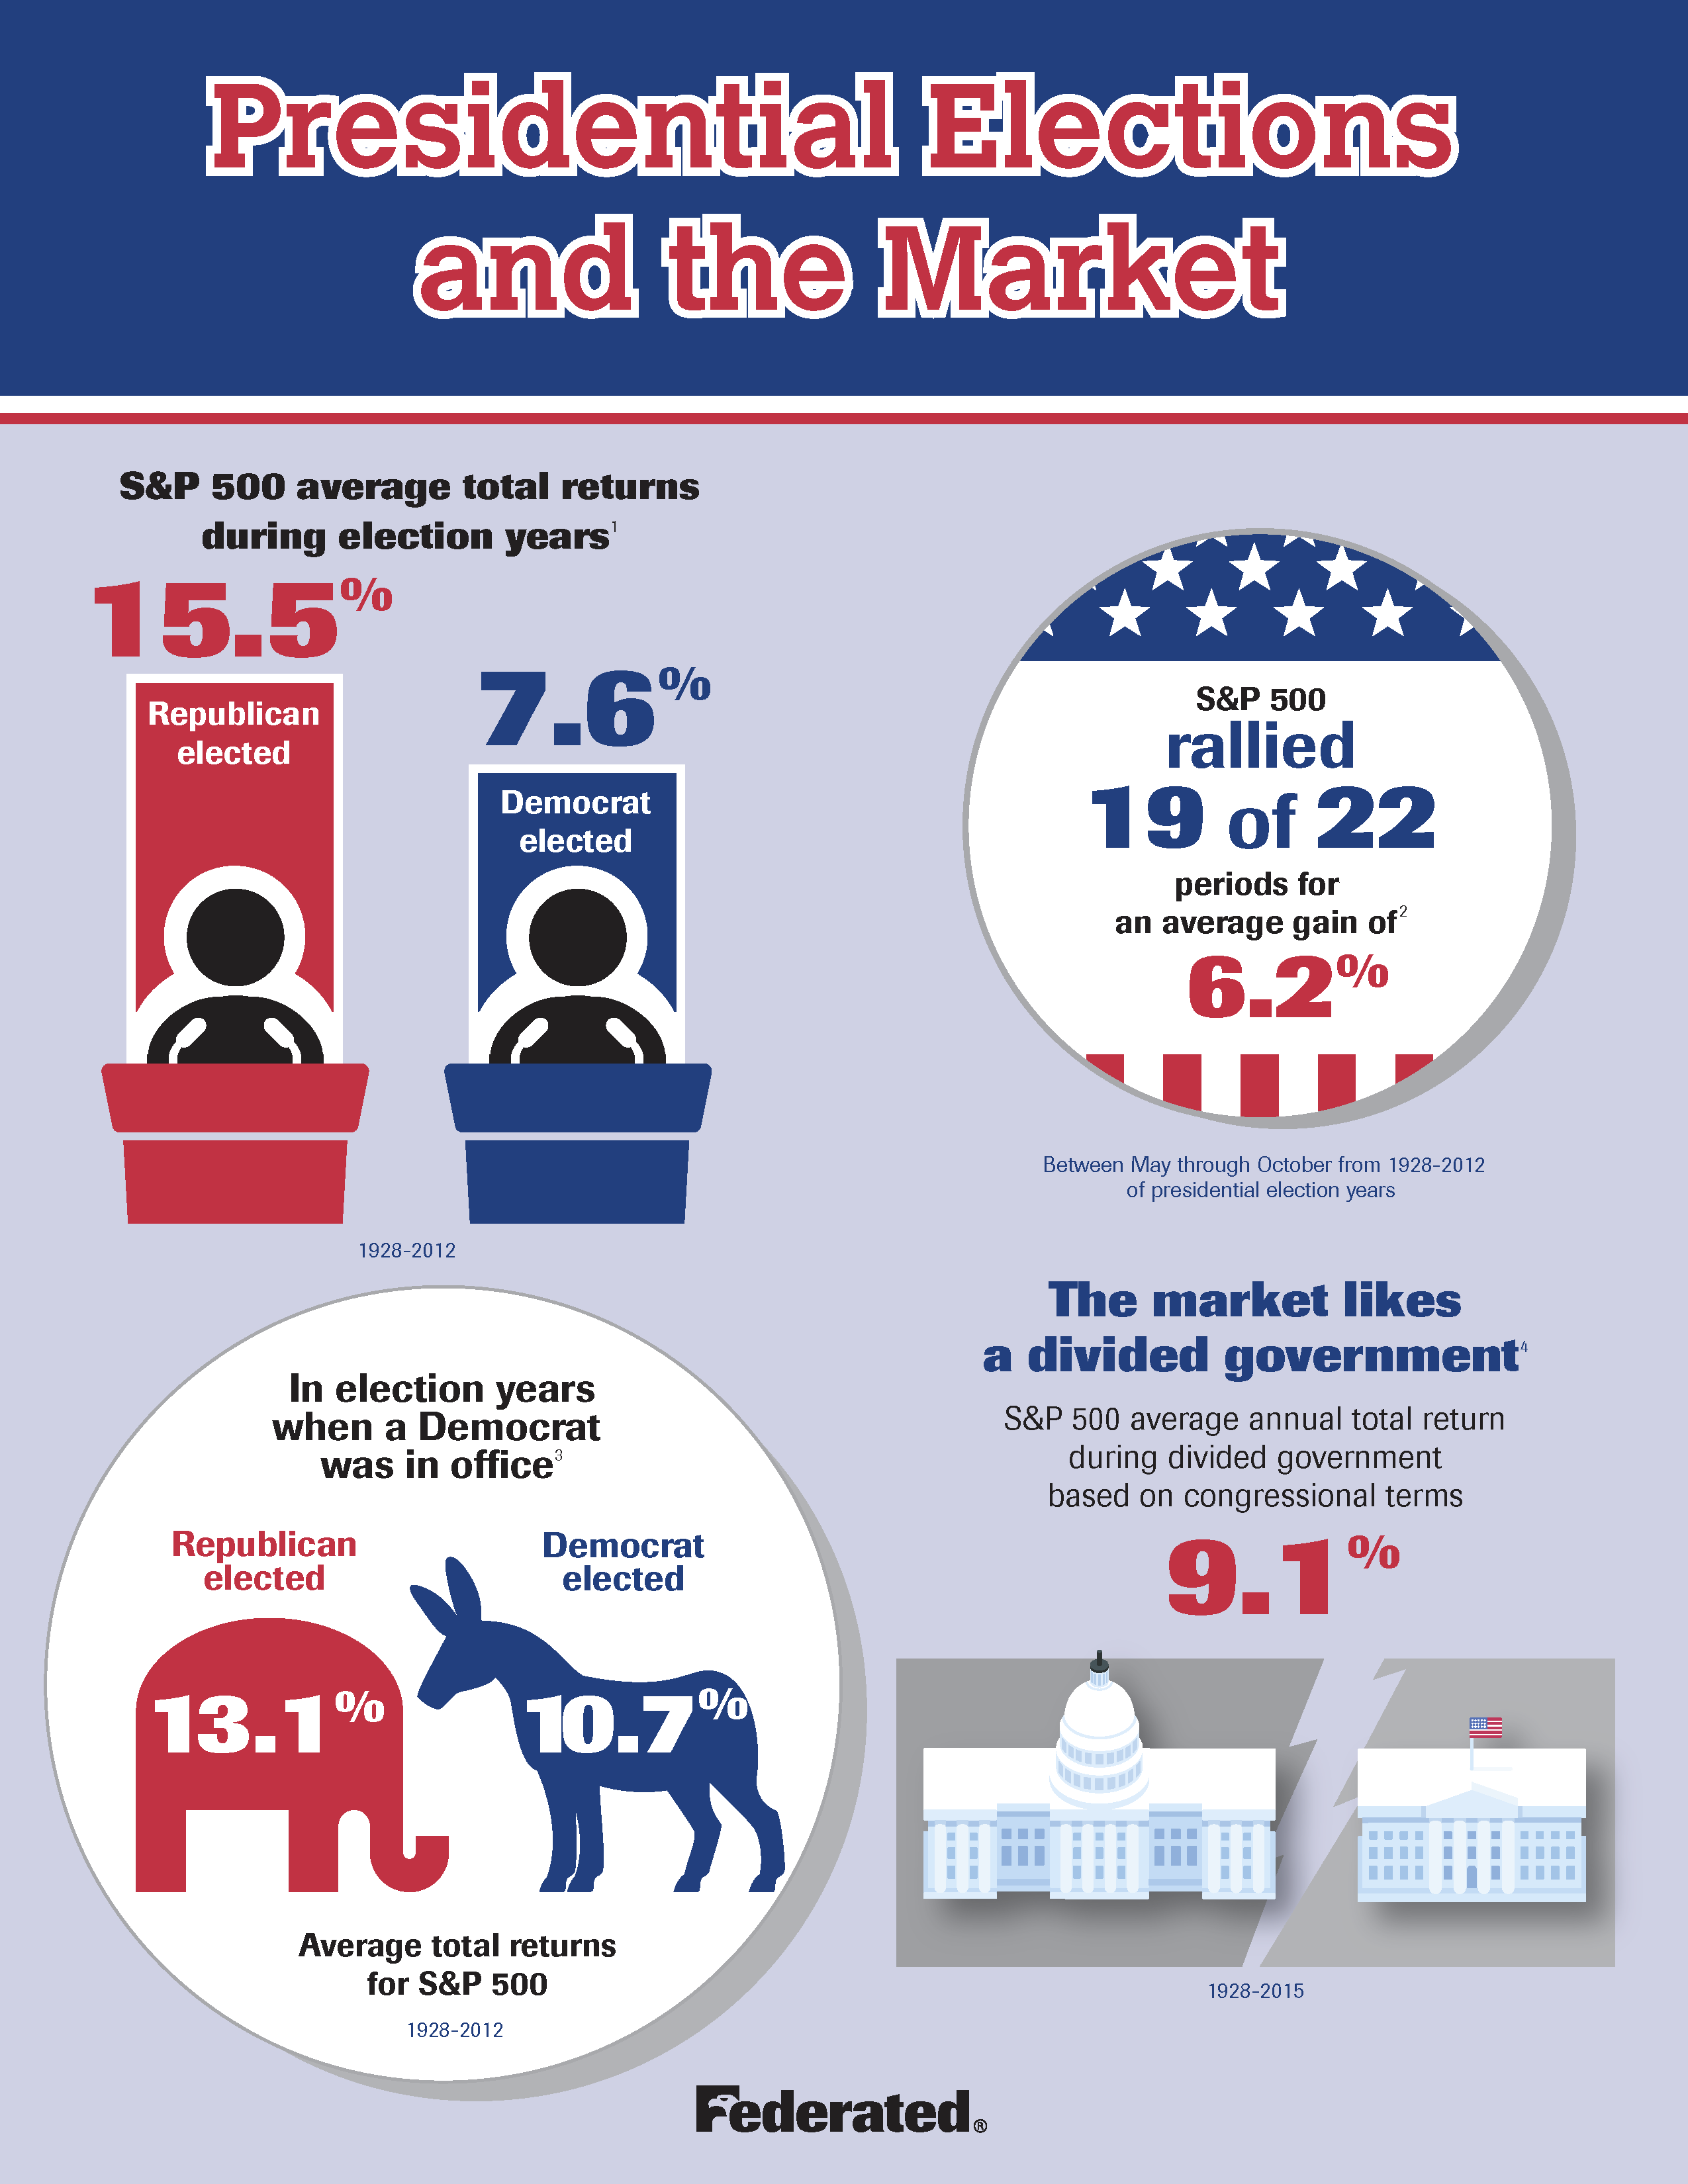
Another interesting fact is that the S&P 500 average total returns are significantly higher in years when Republicans are elected (15.5%) vs. years when Democrats are elected (7.6%). That means investors have seen double the returns in years when Republicans are elected.
In election years when a Democrat was in office, average total returns for the S&P 500 were 13.1% when Republicans were elected and 10.7% when Democrats were elected. Again, the returns were higher with the election of a Republican candidate.
Can Elections Help the S&P 500 Rally?
Of the 22 presidential election years, the S&P rallied for 19 of those years, and the average gains were 6.2%. It would seem our political system is good for the markets, which could be a positive sign for our long-term retirement planning.
The Market Likes a Divided Government
When the White House is held by a different party than Congress, the S&P 500 averages 9.1% per year, as quantified by historic returns between the years 1928 and 2015. Recent returns have held with this trend as our government currently divided. We’ll soon find out if we’ll continue to be divided over the new four years.
These are all interesting trends, and it’s tempting to want to make investment choices based on them. For instance, you might be tempted to invest before the beginning of an election year, banking on the historical data that election years are generally profitable for stocks, and then sell at the end of the election. Most financial advisers, however, will tell you that the safe, boring way of investing (understanding risk and return, , diversifying, and holding quality stocks for a long time) will usually beat playing the election year odds.
That said, it never hurts to talk over your current financial planning strategy, election year or not, with your Wealth Manager. We’re always available to discuss your financial planning questions with you. You can reach us at 1-800-541-7774 or send us a quick note to wealth@wrapmanger.com.
______________________
Sources:
** Marketwatch


